SVG in Web Development
Matt Thomas
Principal System Engineer - UI
What is SVG
Scalable Vector Graphics (SVG) is an XML-based vector image format for two-dimensional graphics with support for interactivity and animation. The SVG specification is an open standard developed by the World Wide Web Consortium (W3C) since 1999.
Why use SVG?
-
Scalable/Responsive
- Scales up & down without loosing clarity
-
Designer Friendly
- Designers often work in vector generating applications
-
Performance/Bandwidth
- Inline SVG doesn't require a separate http request
- Due to text definition allows for compression
-
DOM Manipulation/Stylable
- Can attach event handlers to SVG elements
- CSS can be applied to some SVG elements
- Can be manipulated with JavaScript
-
Browser Support
- Support since 1999, All modern browsers support it
-
Accessibility
- Text remains text in SVG, thus allowing for ARIA to be applied
Why not use SVG
-
Legacy Support
- Internet Explorer 8 and older (I'm sorry!)
- Requires a fallback image
-
Performance
- Complex SVG (1000s of nodes) render performance
- Animation
Browser Support for SVG

Using SVG
| <img> Tag | Use SVG as an image |
| <svg> Tag | Embedding SVG within HTML (Inline) |
| Coordinate System/View Box | Used to define element position and size |
| Elements | Graphical and non-graphical definition |
| Attributes | Styling and behavioral definition |
| Scripts | Just like in HTML, we can embed JavaScript in the image |
Including SVG as an Image

Including SVG Inline
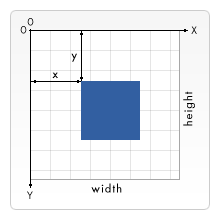
Coordinate System
The coordinate system for SVG starts in the top left corner
with positive x moving to the right and position y moving down.
The coordinate system unit can be integers only and are pixels.
The units apply to all positional and dimensional attributes.
Viewbox
Establishes a view into the SVG that defines a separate position and scale.
See the Pen viewBox Example by Matt Thomas (@matsinet) on CodePen.
Basic Elements
| Line | Segment between to points |
| Circle | Circle using the center and radius |
| Ellipse | Ellipse that has both x & y radius |
| Rectangle | Box defined by a corner and size |
| Polygon | Straight lines that create a closed loop |
| Polyline | Straight lines that do not close/rejoin |
| Path | Collection of Basic Elements |
| Image | Embed raster images and other SVGs |
Basic Elements...
Line
Circle
Ellipse
Rectangle
Polygon
Polyline
Basic Elements...
Path
Path commands
There are 6 types of path commands, for a total of 20 commands:
MoveTo: M, m
LineTo: L, l, H, h, V, v
Cubic Bézier Curve: C, c, S, s
Quadratic Bézier Curve: Q, q, T, t
Elliptical Arc Curve: A, a
ClosePath: Z, z
Upper case commands are absolute and lower case are relative.
Basic Elements...
Image
Group aka g
Group is used as a container for other SVG elements.
This allows you to apply attributes to a group of individual elements.
Attributes
Attributes play a huge role in the SVG ecosystem unlike HTML that uses them but not to the magintude of SVG. SVG uses attributes to style and add functionality to elements.
Some attributes can be applied to the element via CSS but not all.
X, Y & Z
These attributes define axis coordinates in the user coordinate system.
Z is used for locating light sources within filters,
If you need one element on top of another then the draw order matters.
Comes in variations such as x1 & x2 for rectangles and cx & cy for the center of a circle.
Transforms potentially effect the user coordinate system for a given element.
Fill
Defines the color used to paint shapes and text.
The fill colors the interior of the element, not the overall stroke size.
Fill defaults to black.
Stroke
Strokes straddle the shape outline, they increase the size of the shape by a full stroke.
Stroke Dash Array can be used to create dashed lines or progress bars. (Demo coming...)
Stroke defaults to none.
Transform
Defines a list of transform definitions that are applied to an element and the element's children.
Transform functions
Matrix - specifies a transformation in the form of a transformation matrix of six values
Translate - moves the object by x and y
Scale - specifies a scale operation by x and y
Rotate - specifies a rotation by a degrees about a given point
SkewX - specifies a skew transformation along the x axis by degree value
SkewY - specifies a skew transformation along the y axis by degree value
Interactivity
Mouse Interaction with Animation
See the Pen Vue-controlled Wall-E by Sarah Drasner (@sdras) on CodePen.
Javascript Libraries
There are several libraries that allow the creation and manipulation of SVG.
If you need charts, consider D3.js, NVD3.js, MetricsGraphics.js or Brightcharts*.
SVG.js Example
const size = {x: 42, y: 55};
const container = document.createElement('div');
const marker = SVG(container).size(size.x, size.y);
// Create the Pin (the pointy part)
marker.path('M21 55L24 41H18Z');
// Create the SOC graph gutter (behind arc)
marker.circle(35).cx(21).cy(21).addClass('map-gauge-gutter');
// Create the SOC graph arc
const diameter = 35;
const circumference = diameter * Math.PI;
const gaugeValue = Math.round((circumference / 100) * gaugePercent);
marker.circle(diameter).cx(21).cy(21).attr({
  'stroke-dasharray': `${gaugeValue}, ${circumference}`
})
.addClass('map-gauge').addClass('map-gauge-' + gaugeMode);
// Create the Alarm status background using the appropriate color
marker.circle(30).cx(21).cy(21).addClass('map-alarm-status-' + alarmSeverity);
// Create the Alarm count text
const alarmText = marker.plain('' + alarmCount).x(21).y(8)
.font({anchor: 'middle'}).addClass('map-text');
// Create the SOC mode text
const socText = marker.plain(socStatuses[gaugeMode]).x(21).y(18)
.font({anchor: 'middle'}).addClass('map-text map-soc-text font-awesome');
// If the Alarm status background is dark set the font to light for contrast
if (alarmSeverity === 'critical') {
    alarmText.addClass('map-light-text');
    socText.addClass('map-light-text');
}Sourcing SVGs
Find pre-made vector graphics to use in your projects
Vector Graphics Editors
Editors that create/modify vector graphics and can export svg.
If you use an application to create your SVG be sure to optimize them AFTER export. When optimizing SVG always use a graphical interface as optimization may ruin the resulting image.
For additional information High Performance SVGs by Sarah Drasner
People you should follow:
Questions
Feedback...
- Matt Thomas - Principal System Engineer - UI
- Twitter: @matsinet
- Website: https://where.matsinet.codes
- Slides: https://where.matsinet.codes/presentations/svg-in-web-development
- Fullstackers.io
http://fullstackers.io
- St. Louis Full Stack Web Development Meetup
https://www.meetup.com/SaintLouis_FullStack_WebDevelopment/
- STL Tech Slack Team
(Join)
https://stltech.org - STL Full Stack Web Development Slack Channel on the STL Tech Slack Team:
#stl_fullstack_web_dev